Intro

Hello, my name is Liliana Ilut and I am a data professional with a passion for leveraging data to drive insights and improve business outcomes. With over 5 years of experience in the healthcare industry and 2 years in data, I bring a unique perspective to data science. My skills include data analysis, machine learning, and data visualization. I am currently seeking a data scientist, data engineer, or a software engineer role where I can apply my skills and expertise to make an impact in a dynamic and innovative organization.
Languages and tools: Python, SQL, JavaScript, HTML, CSS, R, Pandas, Jupyter, Matplotlib, Scikit Learn, Graph Pad, PostgreSQL, AWS, Flask, Tableau, JIRA, AzureDevOps, GIT.
Check out some of my awesome projects and scientific publications.
During my free time you will find me either baking delicious sourdough bread or enjoying the outdoors (bike, run, hike, walk etc).
Experience

Data Analyst
December 2021 - November 2022
Organized medical data as part of the client data migration support team to ensure it is clinically mappable and valid to internal and external codesets. Gathered metrics from database, utilizing structured query (SQL) programming language to create over 20 end-of-month charts and reports that facilitated prompt handling of client terms. Identified and resolved issues that arose during the migration of client terms into the IMO database while creating and maintaining internal documentation and workflow. Collaborated with the Software Engineer team to create and improve internal tools.
- Played a pivotal role in the team by developing, managing, and executing Airflow jobs in AWS.
- Optimized SQL queries to improve their performance and streamline the migration process.
- Updated both Python and SQL scripts from Oracle to Postgres and ensured their seamless functionality.
- Assisted the release team in successfully launching one of the products over a three-month period.

Research Technologist II
August 2020 - December 2021
Collected experimental research data and performed extensive analysis to design alternatives and effective solutions to improve processes and the accuracy of data collection. Accumulated and assessed raw data and developed a process to translate the data into a digestible format to evaluate team performance. Utilized Microsoft Excel and GraphPad software to prepare, scrutinize and decipher visual graphs and charts for display in scientific publications such as Nature Communication, Molecular Cancer Research and Molecular Immunology. Here is a list of my scientific publications.
- Provided field training to new team members and associates to ensure the safe operation of sensitive laboratory equipment, software and supplies.
- Collaborated with scientists from different laboratories and departments while simultaneously managing multiple complex projects and developments.
Research Technologist I | Lab Manager
November 2012 - August 2020
Maintained accumulative data derived from samples, experiments, workflow and instruments to improve laboratory productivity and operating efficiency. Developed and implemented an easily accessible solid inventory system to optimize and streamline laboratory equipment inventory. Prepared and organized visualizations for several scientific publications and posters involving Proceedings of the National Academy of Sciences of the United States of America (PNAS) and Clinical Cancer Research (CCR). Here is a list of my scientific publications.
- Yielded a 2% operating cost reduction and minimized overall waste through cost-effective supplier relationship management (SRM).
- Designed and created a Microsoft Excel database for inventory management, enabling efficient ordering and tracking of supplies and equipment. to order and track supplies and equipment.
Projects

Developed multiple page application to incorporate the analysis and comparison of numerous datasets discovering the variations and distinctions in the percentage of women in positions of power in different aspects of the labor force. Core contributions were backend, frontend and project management. The application showcased:
- Filter table and graph visualization in D3.js.
- Machine learning visualization and logistic table – Scikit-Learn in Python.
- Time lapse and demographic world map – Tableau.
- ETL built using Pandas within Jupyter Lab and PostgreSQL to merge datasets.
Check out the repo behind the app.
The project was created while attending the Data Science and Visualization Bootcamp at Northwestern University.
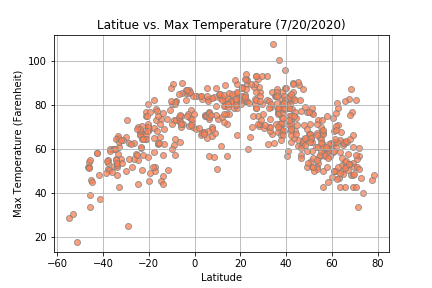
JavaScript Dashboard created to analyze what is the weather like as we approach the equator. We were interested in four different weather factors: temperature, humidity, cloudiness and wind speed.
The visualizations were created using Python script that extracted over 500+ cities across the world using the OpenWeatherMap API. After cleaning the data set form all the empty values, we used Matplotlib to create a series of scatter plots to showcase the relationships between the latitude and the four weather factors we were interested in.
Check out the repo behind the dashboard.
Check out the repo behind the visualizations code.
The project was created while attending the Data Science and Visualization Bootcamp at Northwestern University.

Interactive JavaScript dashboard to explore the microbes that colonize human belly buttons. The data was taken from The Public Science Lab.
The dashboard displays the number of bacteria per culture, the top ten OUTs found and a demographic info for each subject.
Check out the repo behind the dashboard.
The project was created while attending the Data Science and Visualization Bootcamp at Northwestern University.

JavaScript dashboard that has a filter table that shows the number of times a UFO was seen on the sky, its location, duration, the shape of the UFO and any comments. The range of data was between 1/1/2010 and 1/13/2010.
Check out the repo behind the dashboard.
The project was created while attending the Data Science and Visualization Bootcamp at Northwestern University.
Internship

Data Analyst | Campaign Manager
December 2020 - December 2021
Developed data driven strategic recommendations for annual fundraising campaigns and initiatives utilizing Python and structured query (SQL) programming language. Created comprehensive progress reports and business insights through intuitive investigation and interpretation of social media platforms and the collection of statistical campaign data. Employed data analytic strategies and tactics to identify donor giving capacity to develop, implement and launch new campaigns utilizing cost efficient and practical approaches.
- Forecasted the 2021 annual operating budget utilizing Google Spreadsheets based on research and analysis of the previous years budget.
- Monitored, evaluated, and presented data from over 25 monthly campaigns using Google Spreadsheets, and generated visual representations such as pivot charts and tables for comprehensive analysis.
Research Assistant
April 2017 - November 2017
Completed extensive data entry from various input locations to the company server for long-term storage, processing and data management. Allocated support to laboratory team members by assisting with different lab activities and projects.
Publications

"Targeting ULK1 Decreases IFNγ-Mediated Resistance to Immune Checkpoint Inhibitors" published in Molecular Cancer Research on January 18, 2023.
"Discovery of a signaling feedback circuit that defines interferon responses in myeloproliferative neoplasms" published in Nature Communications on April 1, 2022.
"Regulation of IFNα-induced expression of the short ACE2 isoform by ULK1" published in Molecular Immunology on July, 2022.
"Mesenchymal Stem Cells Successfully Deliver Oncolytic Virotherapy to Diffuse Intrinsic Pontine Glioma" published in Clinical Cancer Research (CCR) on March 15, 2021.
"Neural stem cells secreting bispecific T cell engager to induce selective antiglioma activity" published in Proceedings of the National Academy of Sciences (PNAS) on February 24, 2021.
Education
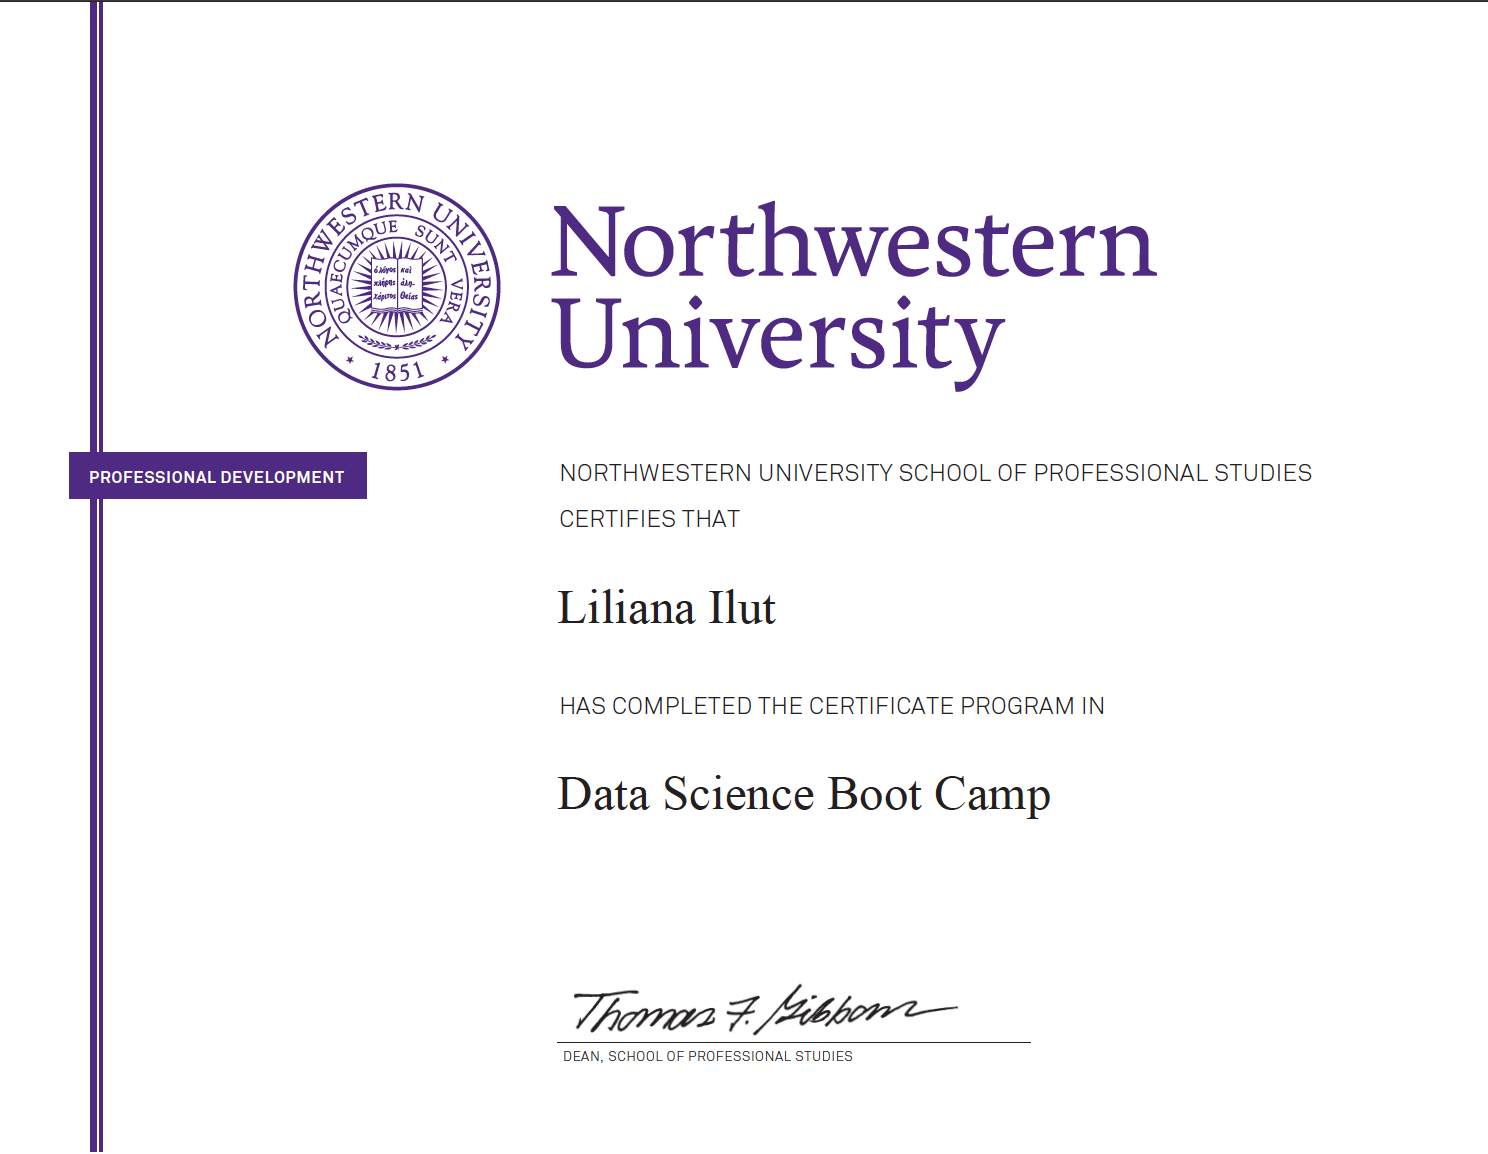
PROFESSIONAL CERTIFICATE IN DATA SCIENCE
Northwestern University, Chicago IL
June 2020 - November 2020
Languages and tools: Python, SQL, JavaScript, HTML, CSS, R, Pandas, Jupyter, Matplotlib, Scikit Learn, Graph Pad, PostgreSQL, AWS, Flask, Tableau, JIRA, AzureDevOps, GIT.
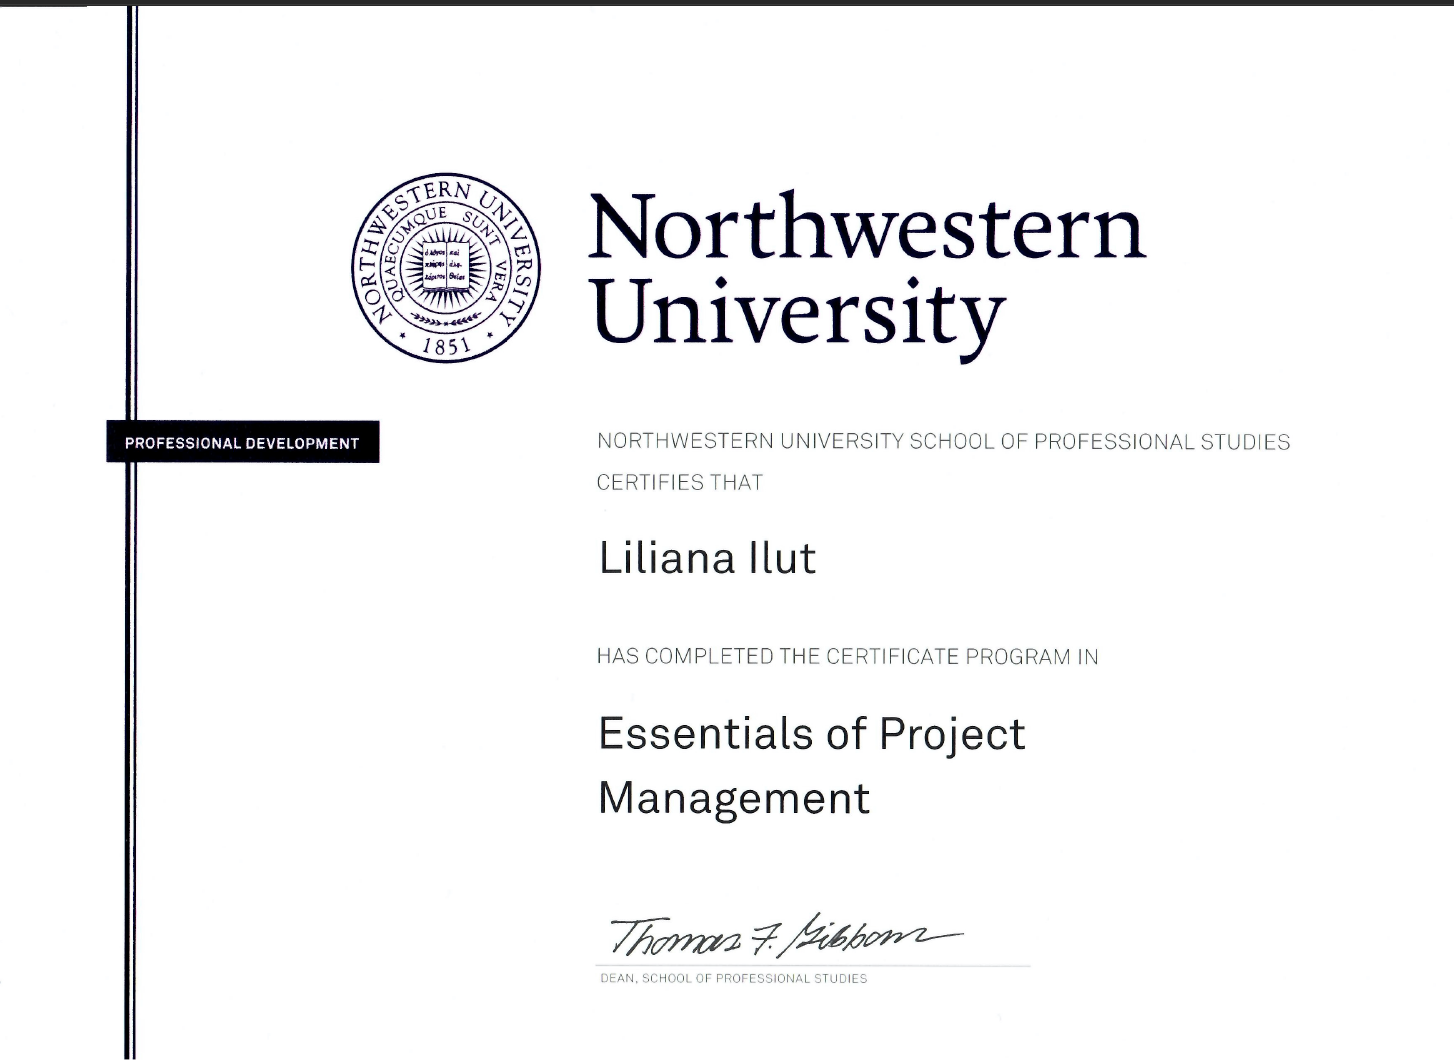
PROFESSIONAL CERTIFICATE IN PROJECT MANAGEMENT
Northwestern University, Chicago IL
May 2019 - February 2020

BACHELOR OF SCIENCE DEGREE IN BIOTECHNOLOGIES
University of Agricultural Sciences and Veterinary Medicine, Cluj- Napoca, Romania
October 2004 - June 2009
Contact
liliana.ilut@gmail.com
(773) 814-9286
Elements
Text
This is bold and this is strong. This is italic and this is emphasized.
This is superscript text and this is subscript text.
This is underlined and this is code: for (;;) { ... }. Finally, this is a link.
Heading Level 2
Heading Level 3
Heading Level 4
Heading Level 5
Heading Level 6
Blockquote
Fringilla nisl. Donec accumsan interdum nisi, quis tincidunt felis sagittis eget tempus euismod. Vestibulum ante ipsum primis in faucibus vestibulum. Blandit adipiscing eu felis iaculis volutpat ac adipiscing accumsan faucibus. Vestibulum ante ipsum primis in faucibus lorem ipsum dolor sit amet nullam adipiscing eu felis.
Preformatted
i = 0;

while (!deck.isInOrder()) {
    print 'Iteration ' + i;
    deck.shuffle();
    i++;
}

print 'It took ' + i + ' iterations to sort the deck.';
Lists
Unordered
- Dolor pulvinar etiam.
- Sagittis adipiscing.
- Felis enim feugiat.
Alternate
- Dolor pulvinar etiam.
- Sagittis adipiscing.
- Felis enim feugiat.
Ordered
- Dolor pulvinar etiam.
- Etiam vel felis viverra.
- Felis enim feugiat.
- Dolor pulvinar etiam.
- Etiam vel felis lorem.
- Felis enim et feugiat.
Icons
Actions
Table
Default
| Name |
Description |
Price |
| Item One |
Ante turpis integer aliquet porttitor. |
29.99 |
| Item Two |
Vis ac commodo adipiscing arcu aliquet. |
19.99 |
| Item Three |
Morbi faucibus arcu accumsan lorem. |
29.99 |
| Item Four |
Vitae integer tempus condimentum. |
19.99 |
| Item Five |
Ante turpis integer aliquet porttitor. |
29.99 |
|
100.00 |
Alternate
| Name |
Description |
Price |
| Item One |
Ante turpis integer aliquet porttitor. |
29.99 |
| Item Two |
Vis ac commodo adipiscing arcu aliquet. |
19.99 |
| Item Three |
Morbi faucibus arcu accumsan lorem. |
29.99 |
| Item Four |
Vitae integer tempus condimentum. |
19.99 |
| Item Five |
Ante turpis integer aliquet porttitor. |
29.99 |
|
100.00 |